Energy Wizard Reporter - Composite Graph
To display this form select : Composite\Graph
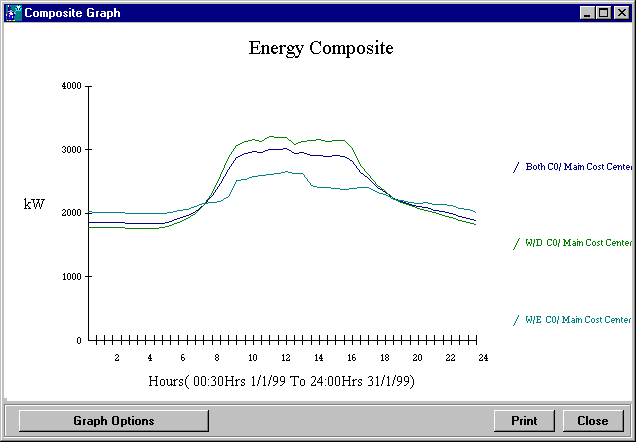
The Composite Graph displays the Composite Data in a graph format.
For other graphs options, click on the "Graph Options" button to display the
Composite graph options form.
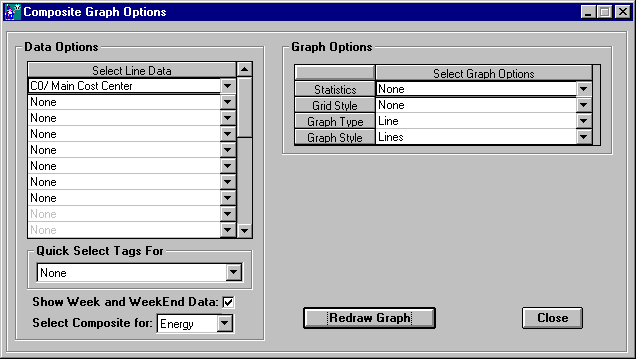
Data Options
- Select Line Data: Select the required Cost Center(s) or Tag(s).
- Quick Select Tags For: To quickly select a Cost Center and ALL of its corresponding
Tags.
- Show Week and Week End Data: If checked then the graph displays Week, Week End and Both
W/D and W/E data, if it is not checked then the graph displays only one line for Both W/D
and W/E Data.
- Select Composite for: "Energy" displays the composite energy data,
"Cost" displays the composite cost data as a product of the composite energy
data multiplied by the respective TOU Slots.
- Graph Options: Select the required graph options.
Wizard Help