Energy Wizard Reporter - Calendar Graph
To display this form select : Store Data\Calendar Graph

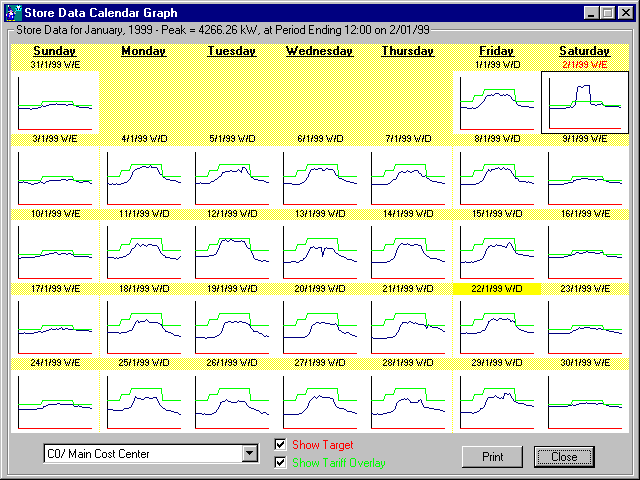
The Calendar Graph creates a thumb-nail sketch for each day's data trend.
Simply select the Cost Center or Tag required.
It is also possible to show a "Target" or reference line. The Target must be set up in the Energy Wizard Reporter and is quite independant to the target used by the Energy Wizard Controller.
For a quick overview of energy consumption versus tarriff profile enable the "Show Tariff Overlay" option. This can be very useful for identifying if certain loads should be moved to different periods of the day.