| Recorder User Help |
| History User Defined Size |
The User Defined size selection is used to manually display historic data of lengths ranging from 1 hour to 31 days or larger. The graph information is read in from the store files and compressed as necessary to fit in the history window.
To create a user defined graph,
select “User Defined...” from the Graph Size combo box in the History
Button Bar, or click the User Defined button "![]() "
on the History Tool Bar.
"
on the History Tool Bar.

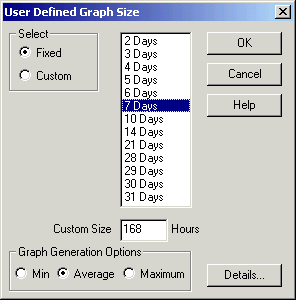
The User Defined Graph Size
dialog box appears.
Select the time required from the list box or type in the
size of the graph in hours into the Custom Size edit box. Press OK to begin
generating the graph or Cancel to exit the dialog box. If the amount of data in
the store files is too small, a warning dialog box will be displayed.
Viewing Very Large Graphs
You can view graphs
larger than 31 days, by entering the size of the graph in hours in the Custom
Size area.
For example to view a 90 day graph, enter 2160 (24 * 60), for 120 days enter
2880 (120 * 24).
Graph Data Generation
The graph
generation options “Min”, “Average” and “Max” are used to determine
how the graph will be generated. Choose “Min” if the graph is to be composed
of the minimum values from the file, “Max” for the Maximum values or
“Average” for the Average values. These are not to be confused with
generating an average, min or max value for the entire data needed for the
graph.
The graph is made up of a
maximum of 2880 points which is the width of the graph display area in the graph
window. If the graph is compressed during its assembly, less than 2880 points
may be used, but it is expanded to fill the whole of the graph window.
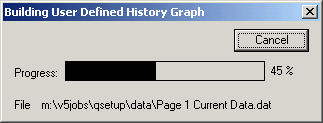
A progress dialog box is shown when the graph is being generated. To abandon the graph generation, press the Cancel button.

When the graph is complete, the Line Details and Graph Scale dialog box can be used in the normal way.
Press the ![]() button to move the graph to the left by the displayed time interval. The
Progress dialog box will appear as the graph is being generated.
button to move the graph to the left by the displayed time interval. The
Progress dialog box will appear as the graph is being generated.
Press the ![]() button to move the
graph to the right by the displayed time interval. The Progress dialog box will
appear as the graph is being generated.
button to move the
graph to the right by the displayed time interval. The Progress dialog box will
appear as the graph is being generated.
To exit from the User Defined Graph, select a fixed time zone from the Graph Size selection or close the History Display by switching to another display, such as Data, Line or Batch.
When the History Window is closed after displaying a User Defined size graph, the next time the History is displayed it will revert back to the last fixed time zone it was set to.
The User Defined Graph can be used when the History is used on a Pages data or when viewing a store file.