| Recorder User Help |
| Graph Scale |
The
Graph Scale dialog box is used to adjust the X and Y axis scales on the trend
graph.
To
access, click “Graph Scale” on the Recorder
Toolbars, or click Graph Scale on the
Recorder’s Display Menu.
Single
Scale Graph
Dual Sc
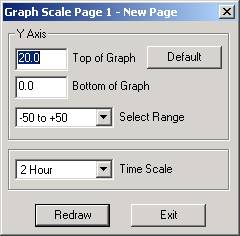
The Y axis field gives details of the graphs Y Axis and the Time Scale field is the time along the bottom of the graph. The Y Axis can be altered in a variety of ways as follows:-
Type the required figures into the two edit boxes “Top of Graph” and “Bottom of Graph” and then press the Redraw button. The graph will be redrawn to reflect the new Y Axis.
Select one of the predefined ranges from the “Select:” combo box. When a range has been selected, its top and bottom figures will appear in the top and bottom edit boxes. Press the Redraw button. The graph will be redrawn to reflect the new Y Axis.
Press the “Default” button. The original scale
values for this graph will be loaded into the top and bottom edit boxes.
Press the Redraw button. The
graph will be redrawn to reflect the new Y Axis.
This is used to return the graph scale to its original range after having
been moved to some other range.
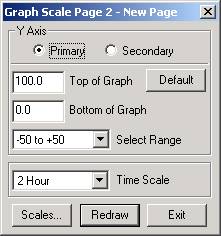
Dual
Scale Graph
On a Dual Scale Graph to change the Primary scale, click on the “Primary” radio button. To change the Secondary scale, click on the “Secondary” button and follow the steps above.
Time: X Axis
The X axis scale is altered by making a selection from the time scale combo
box. Make the selection and press the Redraw button and the graph
will be redrawn to reflect the new time scale. Alterations to both the X and Y
axis can be made at the same time.
The Time Scale setting can also be adjusted using "Graph Size" on the Line
Button Bar and History Button Bar
or by clicking the time buttons on the Line
Tool Bar and History Tool Bar.
The
Recorder Y Axis can also be changed by double clicking on areas of the line
graph.
See Recorder Graph Scale Small.
Notes: