| Setup MicroScan |
| Page Setup: Name & Scales |
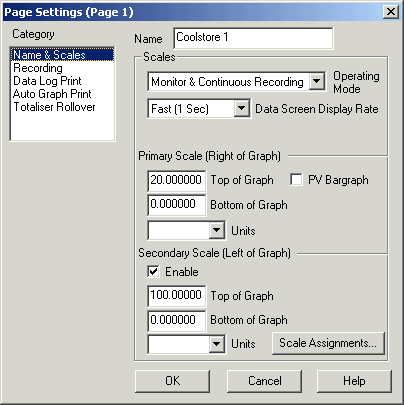
The Name & Scales Category is used to set the Name, Operating Mode and Scales for a Page.

Name
This is a twenty four character name to label the page. The Page Name appears on the Navigation Tree, Data screen and Line graphs and is printed on the Data log printout.
Operating Mode Setting
This selection details one of four modes that the page can be in:-
|
Mode |
Description |
Stores History
Data |
|
Stop |
Data for the lines of this page is not scanned
and not stored to disk. |
No |
|
Monitor |
Data for the lines for this page is scanned for
alarming and viewing but not stored to disk. |
No |
|
Monitor and Continuous Recording |
Data for the lines is scanned as above and is
unconditionally saved to disk |
Yes |
|
Monitor and Batch Recording |
Data for the lines is scanned but is only saved to
the disk when the Batch Mode is on. The Batch Mode allows storage of
Data only when the particular process is running thus one store file is
saved for each batch. (See "Batching
Setup"). When the Batch Mode is selected, two additional
categories will appear in the category list: "Batch Recording"
and "Batch Print". |
Yes |
Data Screen Display Rate
This is the rate that the data will be read into the Data Screen on the Recorder's Window.
Four Options are possible; Fast, Medium, Slow or Custom
which is a user specified time. The times for Fast, Medium and Slow are setup in
Recorder Details, Advanced Settings. When the Custom option
is chosen, an edit field will appear below the Data Screen Display Rate
selection which is used to enter a time. The Data Screen Display Rate has no
effect on the Disk Store Rate but it should be set to be faster that the Disk
Store Rate setting for the page.
If the recorder is set for fast scan on pages 1-10 on the Advanced Settings
window, this options is not available and "Fast Scan" will be shown. A
setting for Data Screen Display Rate cannot be made.
Primary Scale (Right of Graph)
The Primary scale settings apply to the scale on the Right
Hand Side of the Line graph.
Top of Graph & Bottom of Graph
These are the Y Axis settings for the trend graph for the
page, providing an upper limit and lower limit. Any line data that exceeds
these limits will not be drawn on the graph. When the recorder is running
the graph scale may be temporarily changed by using the Recorder's "Graph
Scale" dialog box.
Note: the setting of the Top and Bottom of graph does not
affect the scaling of the individual lines within the page.
This option draws a bar graph to the right of the
recorder's line graph with an arrow in it showing the current value of lines
within the page. When this options is clicked, the Secondary scale is not
visible on the Line Graph.
Units
This is a six character description of the units for the
page. It is drawn at the top of the trend graph.
Dual
Scale Graph : Secondary Scale (Right of Graph)
The Secondary scale settings apply to the scale on the Left
Hand Side of the Line graph. The Secondary scale is used to separate lines on
the page when they have different input ranges. For Example, on one graph we may
want to look at lines with a temperature range of -15 to +15 Deg C and pressures
with a range 0 to 2500 kpa. Then we would set the primary scale to -15 to +15,
and the secondary scale to 0 to 2500.
Secondary Scale Enable
This option is clicked to display a Secondary scale on the
Left hand side of the graph. When the Secondary scale is visible, the PV
bargraph is not available for use.
Top of Graph & Bottom of Graph
These are the Y Axis settings for the trend graph for the
page, providing an upper limit and lower limit. Any line data that exceeds
these limits will not be drawn on the graph. When the recorder is running
the graph scale may be temporarily changed by using the Recorder's "Graph
Scale" dialog box.
Note: the setting of the Top and Bottom of graph does not
affect the scaling of the individual lines within the page.
Units
This is a six character description of the units for the page. It is drawn at the top of the trend graph.
Scale Assignments
The Scale Assignments dialog box is used to choose which lines appear on the Primary or Secondary Scale. Click "Scale Assignments" to access the Scale Assignments dialog box.
See Scale Assignments.
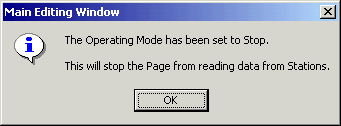
Operating Mode Setting: Stop Mode
If the page is set to the Stop mode, the following Message Box will be displayed
when the Page Dialog box is closed.

You can put the page in the Stop mode if you do not wish it to be scanned, and then return it to the desired mode at a later date when you wish to use it.
See Also
Name
& Scales
Recording
Data Log Print
Auto Graph Print
Totaliser Rollover
Batch Recording
Batch Print